Dashboard and Data Analysis with Excel
By Nohelia Bastidas | Master in Administration | Bachelor in Business Administration
30-day money back guarantee
This course includes:
▪️ 2h 40m duration on demand
▪️ 10 lessons
▪️ 13 downloadable resources
▪️ Available on mobile devices
▪️ Access forever
▪️ Language:
- Spanish
▪️ Unlimited consultations
✦ Bonus: Downloadable Template Set
⚑ Certificate of completion
What you will learn
What you will learn
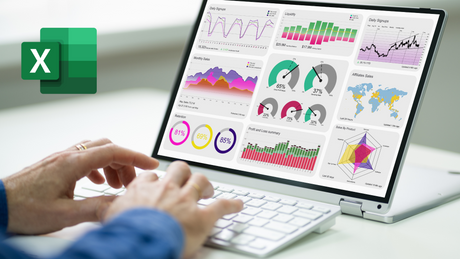
🟧 You will learn how to streamline your daily processes by creating a Dashboard with Excel.
🟧 You will create the step-by-step instructions to build dynamic charts in Excel and insert filters and calculated fields.
🟧 You will create and organize data in Excel pivot tables to connect your reports.
🟧 You will learn how to use Excel add-ins such as Segmenters and Data Query.
🟧 You will learn step by step how to build dynamic charts in Excel and insert filters and calculated fields.
🟧 You will learn how to distribute your reports by placing your Dashboard in a shared space (cloud, servers or portal).
🟧 You will spend less time preparing reports and dedicate more time to analyzing the information to make value propositions
Course content
Course content
U1: Create database
- Create database
- Create Effective Databases in Excel
U2: Create pivot tables
- Create pivot tables
- Creating Pivot Tables in Excel Your Complete Guide
U3: Create dynamic charts
- Create dynamic charts
U4: Insert data segmenters
- Insert data slicers
- Inserting Data Slicers in Excel Your Complete Guide
U5: Designing your Dashboard sheet
- Designing your Dashboard Sheet
U6: Create cards or cards
- Create cards or cards
U7: Structuring your Dashboard
- Create database
Course evaluation
- This course contains a final exam
G-Tools: For Students
- Exclusive access to cutting-edge student tools: improve your employability, participate in exclusive events, take advantage of our intelligent virtual assistant, and more.
⚑ Certificate of completion
- Your personalized digital certificate, a unique badge of your achievements, with international validity, course duration and QR code for instant verification.
__
Downloadable resources:
📎 Set of actionable guides and templates:
▸ Dashboard and Data Analysis Guide with Excel
▸ Excel Guide for Finance
▸ Power BI Introduction Guide
▸ Integrated Management Report Template
▸ Business Budget Report Template and Sparklines
▸ Amortization Table Template for Bank Loans
▸ Project Valuation Template_NPV and IRR
▸ Financial_Statements_Template
▸ Template_Management Report of Indicators and Mini-Charts
▸ Business Budget Report Template and Sparklines
Description
Description
Do you want to streamline your reporting and data analysis in Excel? This course will provide you with the tools and techniques needed to transform your spreadsheets into stunning, dynamic dashboards.
You will learn to create reports efficiently, allowing you to spend more time analyzing your information.
This course will help you increase your productivity and report relevant information quickly, in a summarized and interactive manner. In addition, you will have access to additional resources such as templates and ebooks to complement your learning.
Why choose the course with G-Talent?
We offer a complete and transformative learning experience:
◾️ Deep and Practical Content: Over 2 hours of video content covering everything from the fundamentals of leadership to advanced team management techniques.
◾️ Interactive Methods: Engage with leadership simulations, role-plays, and group discussions that strengthen your practical skills and decision-making ability.
◾️ Leadership Tools: Access a wide range of downloadable resources, including leadership guides, management templates, and effective action plans.
◾️ Community of Leaders: Join our exclusive network of leaders and managers where you can share experiences, challenges and solutions.
◾️ Continuous Support: Receive direct assistance from our experts, who are available to help you overcome any challenges and ensure your success.
◾️ Perpetual Access: Study at your own pace with unlimited access to the course and its future updates.
◾️ Prestigious Certification: Upon completion of the course, you will receive a certificate that supports your leadership and team management skills, opening doors to new professional opportunities.
You will learn the 'art' of creating Dashboards with Excel in 7 steps, using a practical and direct method. In record time!
Companies from all industries invest in the development of their teams with this course from G-Talent and Nohelia Bastidas


Nohelia Bastidas
Master in Administration | Bachelor in Business Administration
About Nohelia Bastidas
About Nohelia Bastidas
Master in Administration | Bachelor in Business Administration
Financial sector expert with over 20 years of experience in finance and business development. Throughout her career, Nohelia has demonstrated a deep understanding of cash flow management and optimization, making her a leading professional in her field. Her focus on improving administrative and technical functions has led her to develop innovative Business Intelligence solutions that automate and present financial information intelligently.
Since 2001, Nohelia has worked in various engineering and consulting firms, always with the aim of optimizing processes and providing strategic value. Her passion for the management and presentation of financial information has been the driving force behind the creation of tools that facilitate strategic decision-making based on relevant and automated data.
Why choose to learn with Nohelia Bastidas?
▪️ Proven experience: Over 20 years in the financial sector, developing a deep understanding of cash flow management and optimization.
▪️ Innovative solutions: Co-creator of Business Intelligence tools that automate the presentation of financial information to facilitate strategic decisions.
▪️ Practical approach: Nohelia shares her real, practical experience in improving administrative and technical functions, providing learning applicable to your career.
▪️ Guaranteed results: Your course is designed to transform your financial management, teaching you to master cash flow and improve the efficiency of your business.
Take advantage of the opportunity to learn with Nohelia Bastidas and transform your financial management! Enroll now in her Cash Flow course and master the tools you need to take your business to the next level.

Practical Tutorial on Pivot Tables
By enrolling in our course, you will be one of the first students to receive classes designed to master, from zero to advanced, the creation of Pivot Tables in Excel.
Don't miss this opportunity to obtain a valuable resource that complements this course.
Limited places available, sign up now!
Me gusto mucho el curso, me ayudó a resolver dudas que tenía con respecto a esta gran herramienta. Lo recomiendo al 💯
Se ha aprendido bastante y se ha aplicado en mis jornadas laborales
si con este curso aprendí paso a paso a como desarrollar un dashbord de forma detallada y que pueda ser analizada por los asuarios de dichos datos, lo que me gusta es explica por pasos y lo que se tiene que hacer para realizar el documento de analisis.
Me encantan los cursos, cuando tengo la oportunidad los trabajo en pantalla grande en el tv de casa. Los he escuchado en el trabajo pero voy poco a poco. Son de gran utilidad para lo que estoy trabajando. O sea hago la práctica con muchos de mis trabajos. En origen solo iba a pedir el de flujo de caja por que fue la tarea que me encomendaron y ha sido un éxito gracias a estos cursos. No los he terminado pero lo haré. Fue muy buena decisión tomarlos!
Excelente material y presentación, muy explicita y de fácil entendimiento
Muy útil la información, bien detallado. Pude seguir todos los pasos al pie de la letra. Objetivo de aprendizaje 100% logrado
Gracias al curso, he aprendido a realizar análisis de datos eficientes con Excel. Puedo identificar tendencias, patrones y anomalías en mis datos, lo que me ha permitido obtener información valiosa para mi negocio
Considero que este curso es una inversión valiosa para profesionales de diversos campos que buscan mejorar sus habilidades en la gestión y análisis de datos. Los conocimientos adquiridos son aplicables a una amplia gama de áreas.
El curso me ha ayudado a mejorar la toma de decisiones en mi empresa al proporcionarme las herramientas para analizar datos y crear dashboards informativos. Ahora puedo tomar decisiones basadas en datos concretos, lo que ha aumentado la eficiencia y la rentabilidad de mi negocio
El curso me ha brindado las herramientas y habilidades necesarias para crear dashboards impactantes y visualmente atractivos en Excel. Ahora puedo comunicar datos complejos de manera clara y concisa a mi audiencia, lo que ha permitido mejorar la toma de decisiones en mi empresa
Explore other courses from Nohelia Bastidas
Discover other courses and learn something new today. Learn from the best!
Best selling courses
-
Handling Difficult People at Work: Effective Strategies to Improve Your Work Environment
★★★★★(19)$15.99 USD$59.99Unit price /Unavailable -
-
-
-
-
Analytics and Artificial Intelligence with Power BI
★★★★★(10)$15.99 USD$75.00Unit price /Unavailable -
ChatGPT for Professional Tasks and Microsoft Office
★★★★★(14)$15.99 USD$67.00Unit price /Unavailable -
-
-
B2B Consultative Sales: Innovation and techniques for extraordinary results
★★★★★(9)$15.99 USD$97.00Unit price /Unavailable -
-
-
-
-
-
-
-
Training of Internal Auditors in Quality Management Systems
★★★★★(179)$15.99 USD$74.99Unit price /Unavailable
What to expect from G-Talent courses?
-
Study at your own pace
Get video courses, taught by top instructors, to study at your own pace
-
Learn from the best
Provides high quality courses developed by carefully selected experts
-
Quality guaranteed
Not sure? All our courses offer a 30-day success guarantee
-
Permanent accompaniment
Learn at your own pace, with lifelong updates, access and support.
-
Personalized certificate
Get a world-class certificate, with international validity and a unique encrypted QR code
-
G-Tools: For Students
Find all the tools you need for your employability in one place.


